Get 40% Off
🚨 Volatile Markets? Find Hidden Gems for Serious Outperformance
Find Stocks Now

The Dollar Continues To Weaken, But What's 'Up' With Gold?

Published 07/07/2017, 06:41 AM
Updated 07/09/2023, 06:31 AM

The dollar continues to weaken, yet gold finds no incentive to rally.

What gives?

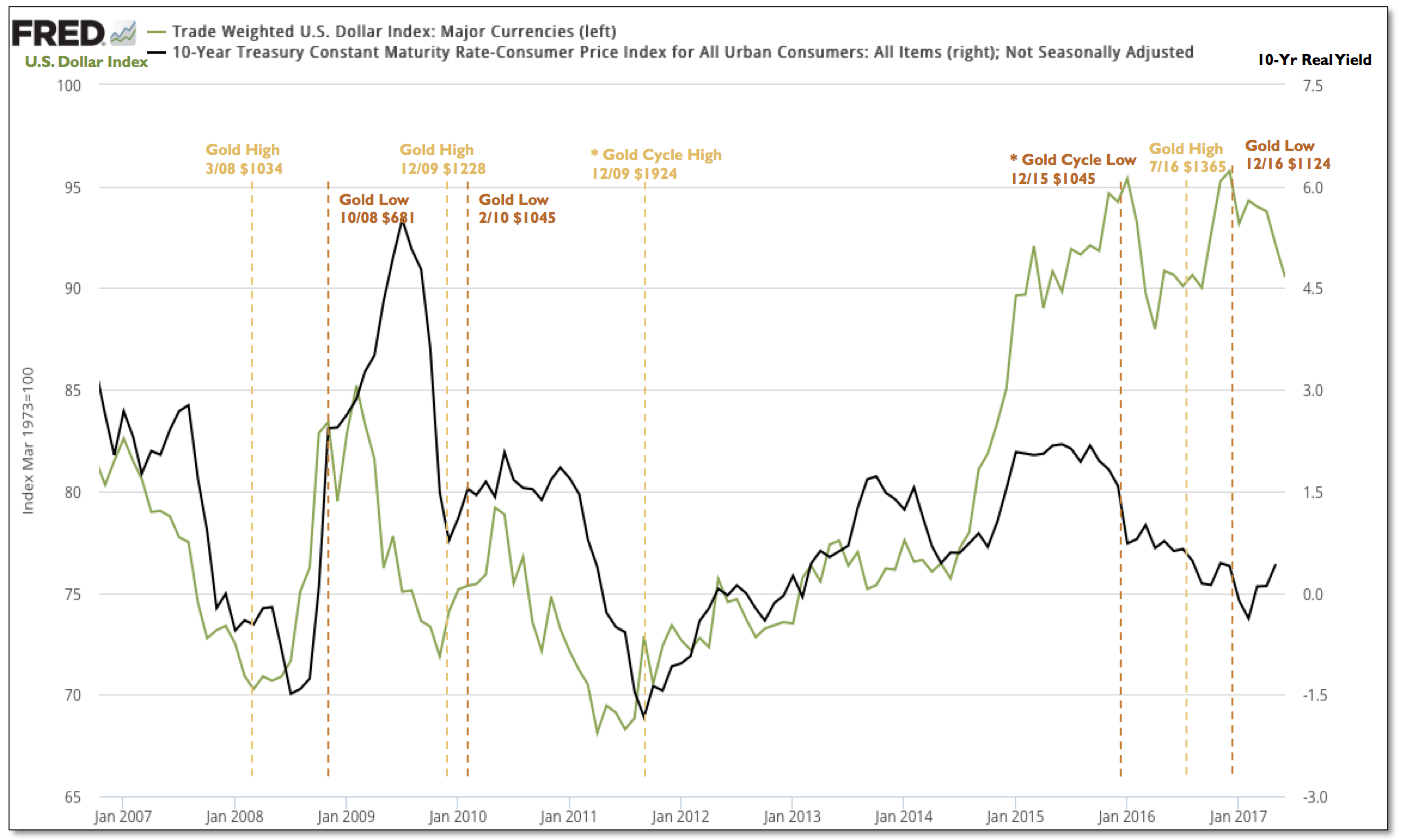
Fundamentally, in the basic real yield equation (nominal yields less inflation) – which arguably is the main long-term driver of the price of gold – the year-over-year inflation figures have underwhelmed of late.
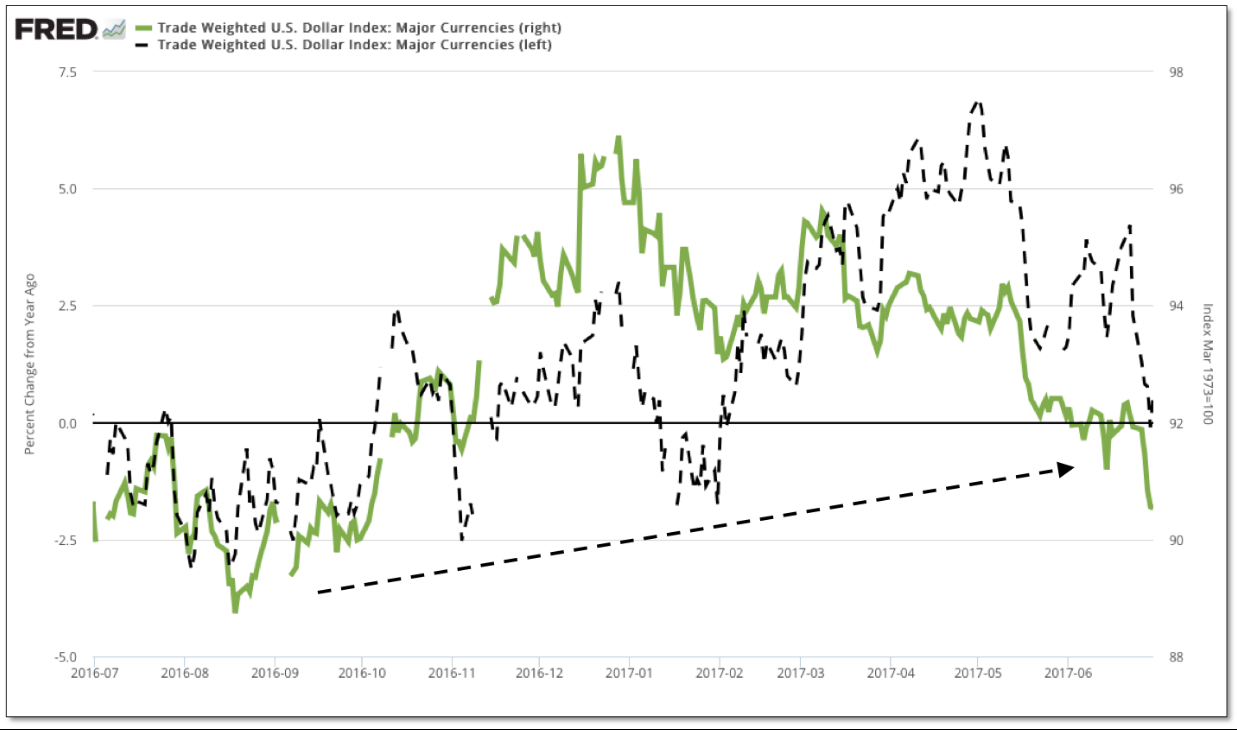
Trade Weighted US Dollar Index

This is primarily because despite breaking down again from the highs last December, on a year-over-year performance basis the dollar has actually trended higher, essentially arresting the respective moves of higher inflation and lower real yields that began in the back half of 2015. This led the cyclical pivot higher in gold in late December of that year.
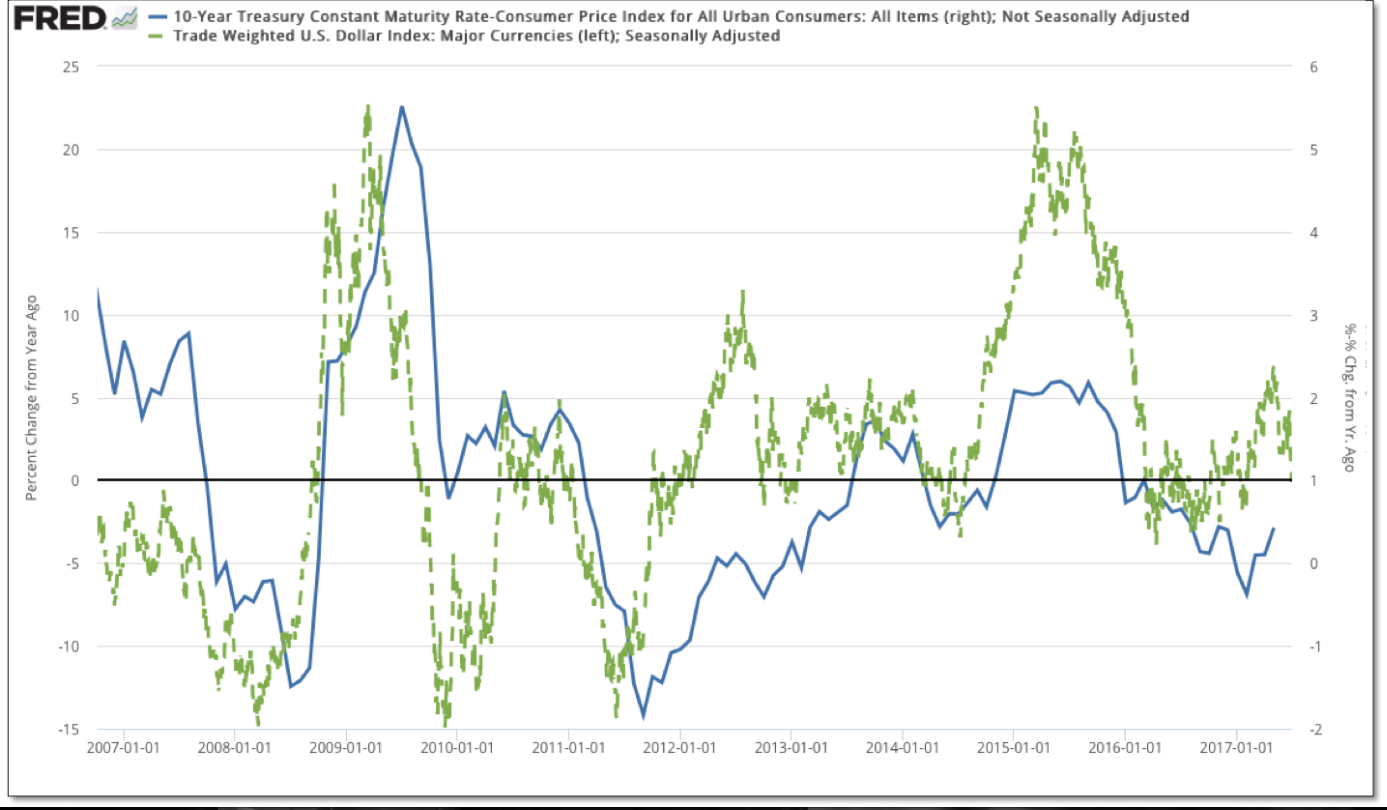
10-Year Treasury vs. Trade Weighted US Dollar Index

Big-picture-wise, the dollar has remained largely range bound over the past 2½ years. However, it's the dollar's relative performance (YOY) trend that has wagged inflation and the direction of real yields. Until the dollar can break below the lows of last summer and fracture the very broad top that’s extended the range since 2015, both gold and the prospects for higher inflation/lower real yields will remain range bound as well. This perspective also applies to the numerating side of the real yield equation, as long-term yields – despite weakening again this year, are significantly higher than where they were a year before.
GLD vs. UUP 2-Hour Chart

That said, the positive long-term development for gold is that although prices have recently been impacted by more hawkish policy expectations abroad, which has dragged US nominal and real yields higher, the dollar index has taken the next step lower beneath last November’s ephemeral post election breakout, with long-term support extending from the over 2½ year range directly below.
3rd party Ad. Not an offer or recommendation by Investing.com. See disclosure here or remove ads .

Trade Weighted US Dollar Index

Our expectations remain that the cyclical bull market in the dollar is over, and a breakdown below long-term support will rejuvenate the move higher in gold – as well as the next leg lower in real yields. From our perspective, it is the dollar's relative historic extreme that presents the largest catalyst for a continued move lower in real yields and a resumption of the bull market in gold.
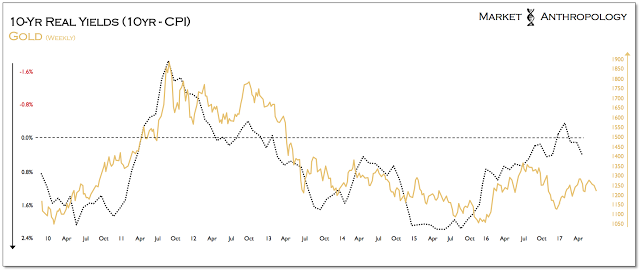
10-Yr Real Yields vs Gold Weekly Chart

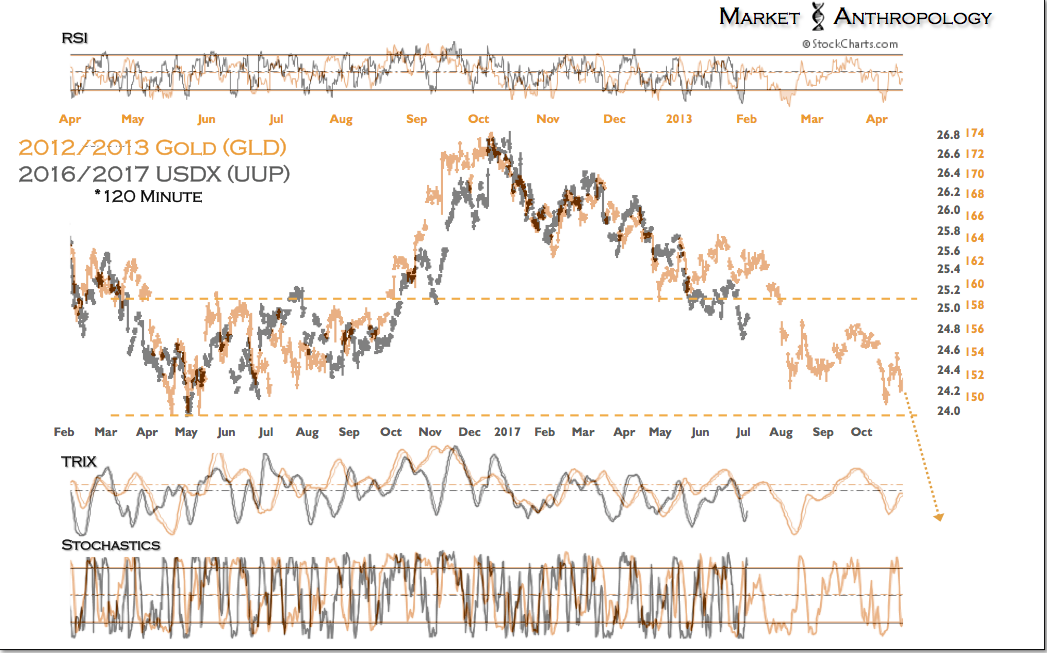
The US dollar index continues to mimic gold's pattern breakdown from it's broad top carved across Q2 2011 to Q1 2013. Although gold will likely remain range bound this summer until long-term support is broken in the dollar, we'd speculate that as the dollar makes its way back to the lows from last summer, gold will regain a foothold as the retracement rally in yields also runs its course.
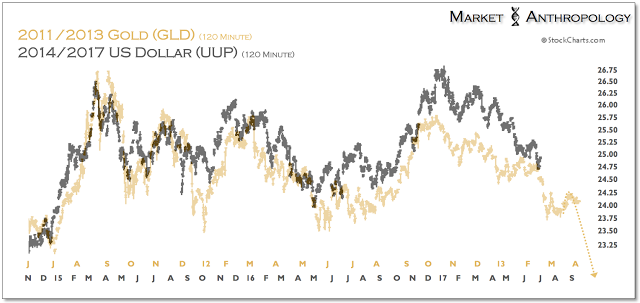
GLD 2011/2013 and UUP 2014/2017 Chart

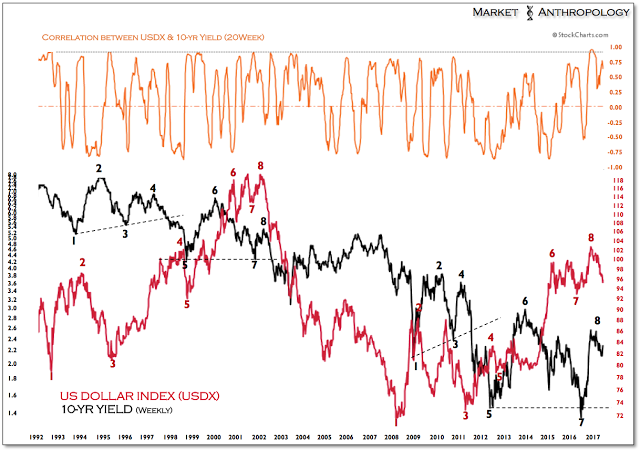
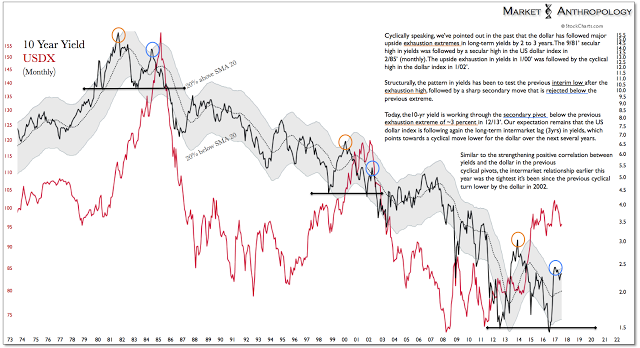
10 Year Yield vs USDX Monthly Chart

Correlation Between USDX vs 10-Yr Yield 20 Weekly Chart

Latest comments

Great!
Risk Disclosure: Trading in financial instruments and/or cryptocurrencies involves high risks including the risk of losing some, or all, of your investment amount, and may not be suitable for all investors. Prices of cryptocurrencies are extremely volatile and may be affected by external factors such as financial, regulatory or political events. Trading on margin increases the financial risks.
Before deciding to trade in financial instrument or cryptocurrencies you should be fully informed of the risks and costs associated with trading the financial markets, carefully consider your investment objectives, level of experience, and risk appetite, and seek professional advice where needed.
Fusion Media would like to remind you that the data contained in this website is not necessarily real-time nor accurate. The data and prices on the website are not necessarily provided by any market or exchange, but may be provided by market makers, and so prices may not be accurate and may differ from the actual price at any given market, meaning prices are indicative and not appropriate for trading purposes. Fusion Media and any provider of the data contained in this website will not accept liability for any loss or damage as a result of your trading, or your reliance on the information contained within this website.
It is prohibited to use, store, reproduce, display, modify, transmit or distribute the data contained in this website without the explicit prior written permission of Fusion Media and/or the data provider. All intellectual property rights are reserved by the providers and/or the exchange providing the data contained in this website.
Fusion Media may be compensated by the advertisers that appear on the website, based on your interaction with the advertisements or advertisers.
© 2007-2024 - Fusion Media Limited. All Rights Reserved.